Alternative Material & Cost Reduction Solutions
💰 Lifecycle Cost Focus 📊 DFM / DFMA
🤝 Supplier Alignment ✅ Verified Performance
Outcome
Repeatable Fixes • Verified • Production‑Ready
Design & Manufacturing Optimization

Material Substitution & Specification
Evaluate alternate alloys, engineered plastics, elastomers and coatings with tradeoffs for strength, conductivity, weight and cost—plus corrosion and lifecycle implications.

Process Route Optimization
Move parts to more appropriate processes—die casting, molding, forging, extrusion, or hybrid approaches—to gain per‑part savings and throughput improvements.

Part Consolidation & Design Simplification
Consolidate multi‑piece assemblies into fewer parts, reduce fasteners and simplify assembly to cut BOM, labor and quality gates.
How We Reduce Cost Without Compromising Function
Intake & Cost Drivers
Review BOM, cycle times, material costs, finish requirements and supplier pricing to identify top cost drivers and risk items.
Technical Feasibility
Assess performance impact of alternate materials/processes with CAE, hand calculations and historical data to shortlist options.
Prototype & Test
Build and test representative parts or subassemblies to validate performance, environmental resistance and manufacturability.
Supplier & Scale Evaluation
Determine supplier readiness, tooling investments and minimum order impacts; run cost models for scaled production.
Handover & Monitoring
Release updated drawings, process instructions, control plans and KPI monitoring to ensure expected savings and quality.
Core Services
Material Evaluation & Substitution
Process Route Optimization
Part Consolidation & Assembly Simplification
Finishing & Coating Tradeoffs
Examples & Typical Outcomes

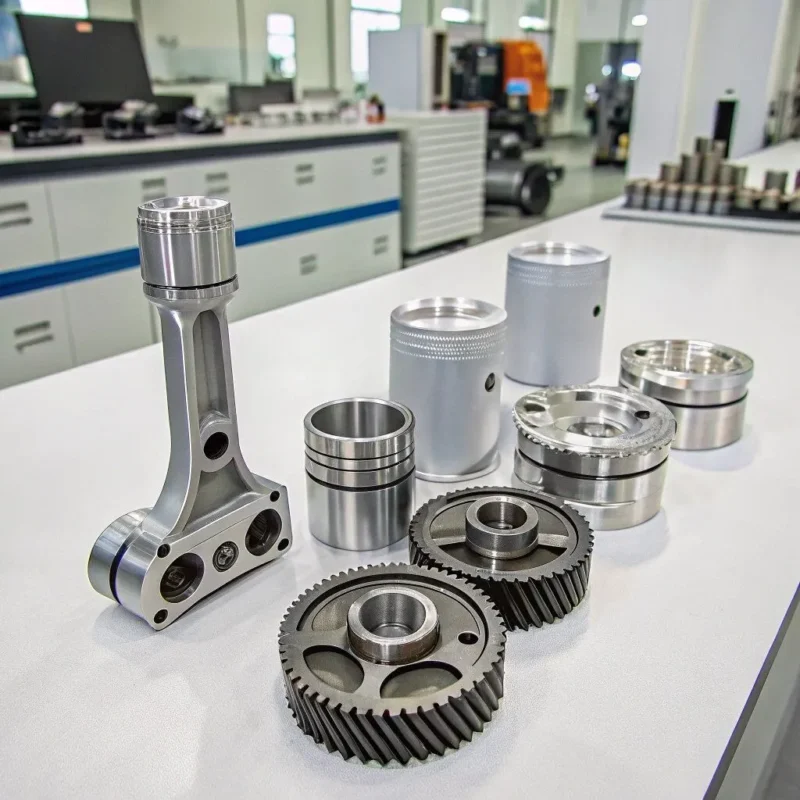
Example: Die Cast Housing vs CNC Machined Block
Re‑engineer an aluminum housing from machined block into a die cast with machined critical faces. Result: reduced cycle time, material waste and per‑part cost after tooling amortization; slight increase in NRE tooling but lower total landed cost at volume.

Example: Plastic Overmold vs Mechanical Assembly
Replace multi‑piece bracket assembly with a single injection molded component with integrated ribs and snaps. Result: lower assembly labor, fewer fasteners and improved cosmetics.
Typical savings vary by program but commonly fall in the range of 10–40% total landed cost depending on volumes, material price sensitivity and consolidation opportunity.
Analysis We Deliver

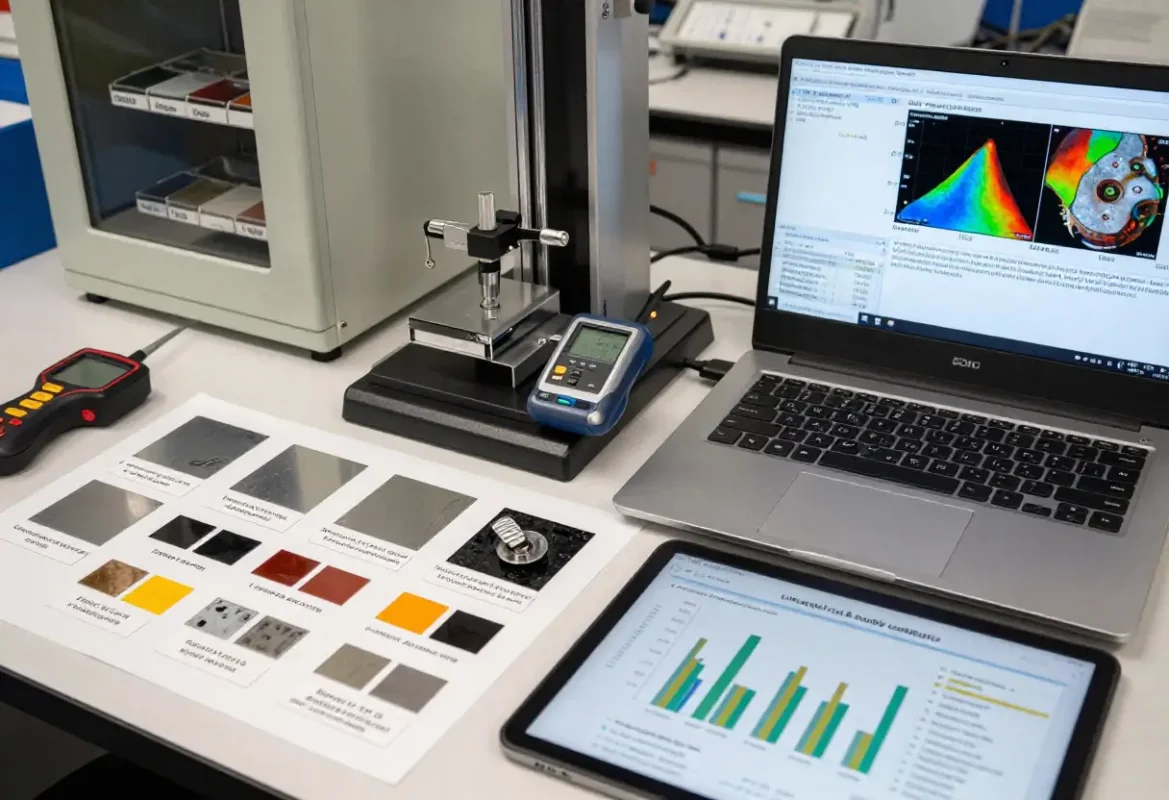
Cost vs Performance Report
Side‑by‑side cost model, lifecycle impacts, and technical risk assessment for shortlisted alternatives.

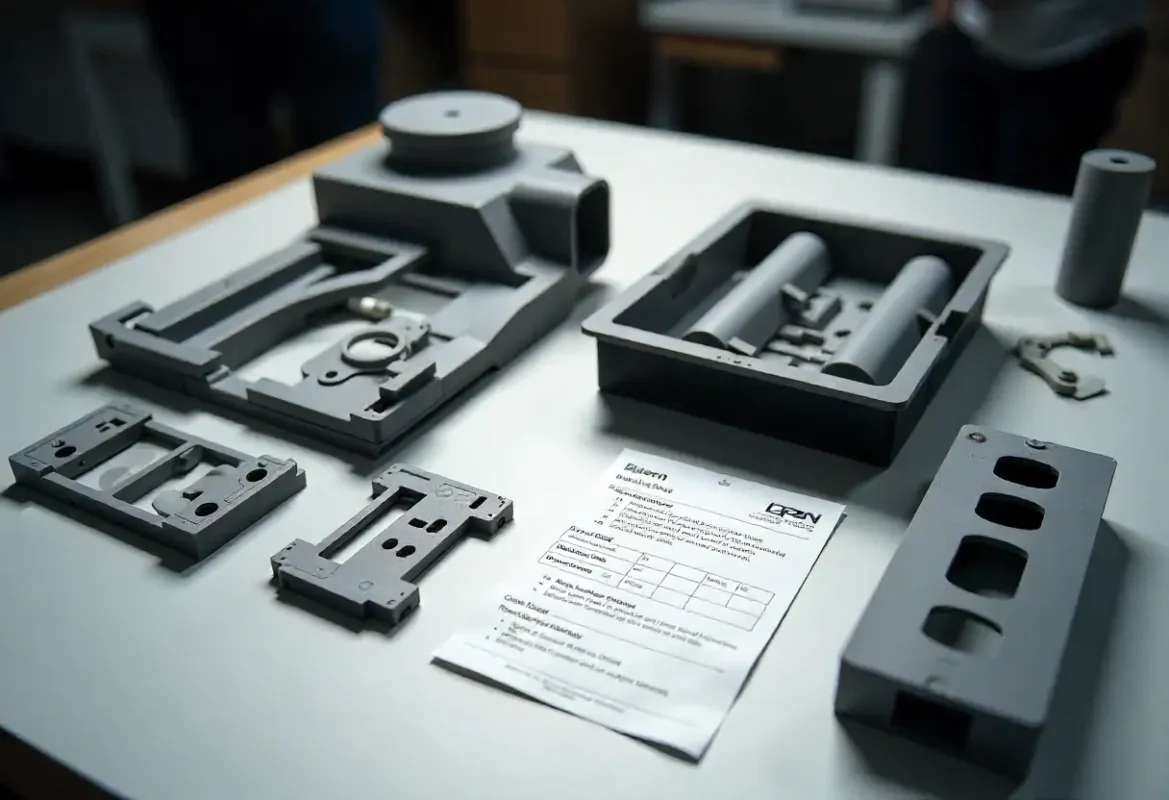
Prototype Validation Summary
Test results, pass/fail criteria, recommendations and implementation notes for production release.
Deliverables, Contents & Typical SLA
| Deliverable | Contents | Typical SLA |
|---|---|---|
| Quick Cost Snapshot | High‑level BOM and process cost comparisons with recommendation | 2–5 business days |
| Feasibility & CAE Assessment | Technical feasibility, CAE/strength or thermal checks, shortlist of options | 1–2 weeks |
| Prototype & Test Report | Prototype build notes, test protocol and measured outcomes | 2–4 weeks |
| Production Implementation Plan | Supplier readiness, tooling NRE, quality gates and expected savings | Aligned to program schedule |

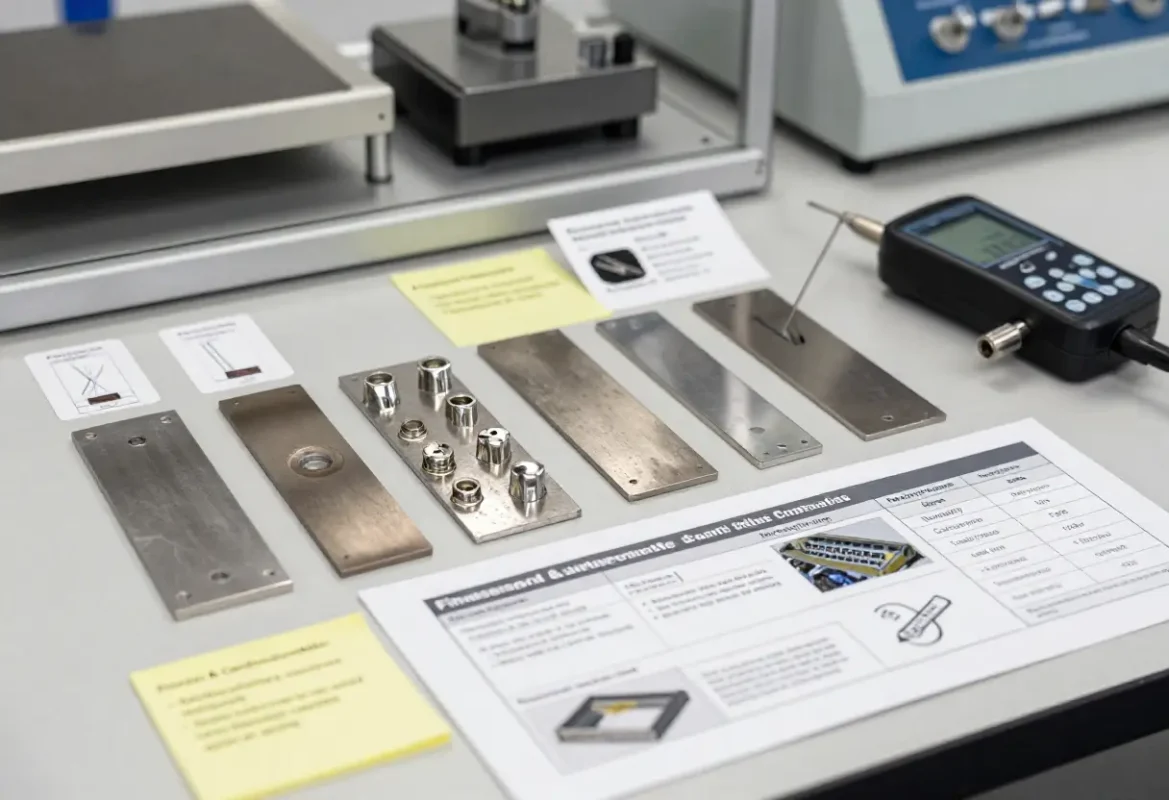
Supplier & Quality Integration
We work directly with supplier engineering and quality teams to implement changes, update process controls, and supervise first article runs when required. Our goal is a single auditable path from failure to validated SOP.
If on‑site support is required, we provide field engineering to collect evidence, witness tests, and accelerate closure.